Code
pavian::runApp(port = 5000)High-quality reads obtained after preprocessing were taxonomically classified using Kraken2 to characterize the microbial composition associated with Deroceras laeve samples.
A custom multi-kingdom reference database was built using Kraken2 and NCBI taxonomy resources.
The database included the following libraries:
module load kraken/2.0.8-beta

kraken2-build --download-taxonomy \
  --threads 20 \
  --db multi_kingdom_db

kraken2-build --download-library bacteria --threads 20 --db multi_kingdom_db
kraken2-build --download-library viral   --threads 20 --db multi_kingdom_db
kraken2-build --download-library fungi   --threads 20 --db multi_kingdom_db
kraken2-build --download-library archaea --threads 20 --db multi_kingdom_db
kraken2-build --download-library human   --threads 20 --db multi_kingdom_db
kraken2-build --download-library plant   --threads 20 --db multi_kingdom_db
kraken2-build --download-library animal  --threads 20 --db multi_kingdom_db

kraken2-build --build \
  --db multi_kingdom_db \
--threads 30Filtered paired-end reads generated after Cutadapt trimming were classified against the custom database.
kraken2 --db multi_kingdom_db \
  --threads 20 \
  --paired dlaeve1_R1cut.fastq dlaeve1_R2.fastq \
  --output dlaeve1.kraken \
--report dlaeve1.reportFor each sample, Kraken2 generated:
Classification output files (*.kraken)
Taxonomic summary reports(*.report)
These reports were used for downstream visualization and abundance analyses.
Kraken2 reports were explored in Pavian to inspect taxonomic assignments and generate Sankey diagrams summarizing multi-kingdom composition.
pavian::runApp(port = 5000)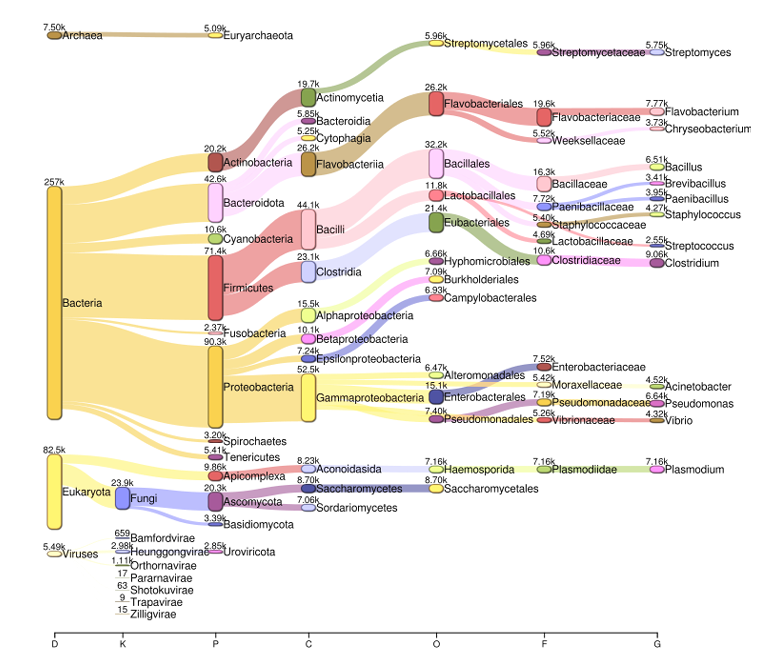
This step facilitated rapid inspection of kingdom-level distributions across samples.
Per-sample Kraken2 reports were merged into a BIOM-formatted table for downstream analyses in R.
kraken_biom.py \
  dlaeve1.report \
  --fmt json \
-o dlaeve_taxonomy.biomThe resulting BIOM table was imported into R using the phyloseq package for taxonomic filtering, abundance summaries, and graphical analyses.
These steps are detailed in the next chapter: Taxonomic Analysis.